Core Web Vitals are the metrics Google uses to measure how users experience the loading performance, interactivity, and visual stability of your web pages. These metrics have been a ranking factor since 2021, and Google has only increased their emphasis over the years. If your pages fail Core Web Vitals thresholds, you are leaving rankings on the table regardless of how good your content is.
how I started these niche websitesThis guide covers the three Core Web Vitals metrics, how to measure them, and the specific techniques I use to optimize them on my websites.
Understanding the Three Core Web Vitals
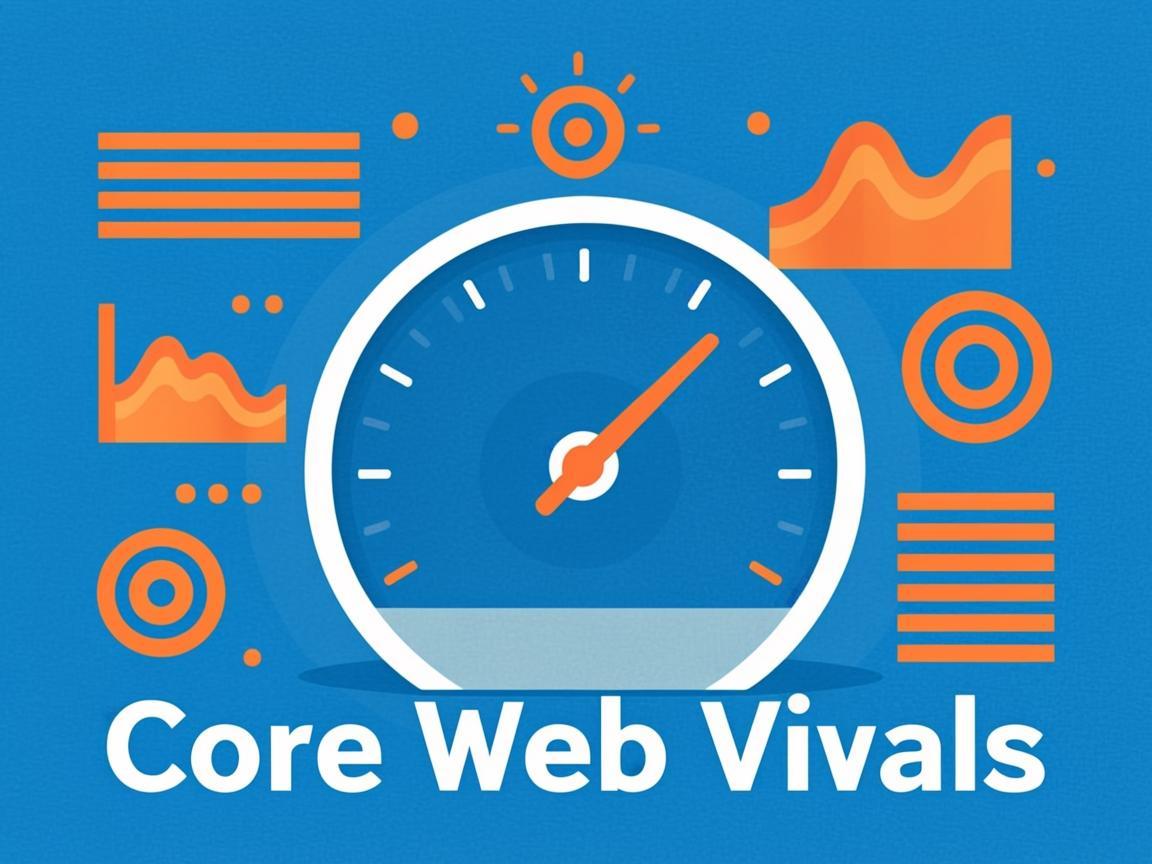
Google evaluates your pages on three specific metrics. Each one measures a different aspect of the user experience.
Largest Contentful Paint (LCP)
LCP measures how long it takes for the largest content element in the viewport to become visible. This is usually a hero image, a large heading, or a featured video.
Google's threshold:- Good: Under 2.5 seconds
- Needs improvement: 2.5 to 4 seconds
- Poor: Over 4 seconds
Interaction to Next Paint (INP)
INP replaced First Input Delay (FID) as the responsiveness metric in March 2024. It measures how long it takes for your page to respond to user interactions like clicks, taps, and key presses throughout the entire page lifecycle.
Google's threshold:- Good: Under 200 milliseconds
- Needs improvement: 200 to 500 milliseconds
- Poor: Over 500 milliseconds
Cumulative Layout Shift (CLS)
CLS measures visual stability by tracking how much content moves unexpectedly as the page loads. You have experienced bad CLS when you try to click a button and an advertisement shifts the page, causing you to click the wrong thing.
Google's threshold:- Good: Under 0.1
- Needs improvement: 0.1 to 0.25
- Poor: Over 0.25
How to Measure Your Core Web Vitals
Before optimizing anything, you need to know your current scores. Here are the tools I use.
PageSpeed Insights
Google's PageSpeed Insights is the starting point for Core Web Vitals measurement. Enter your URL and it provides LCP, INP, and CLS scores for both mobile and desktop, along with specific suggestions for improvement.
Important:Google Search Console
Search ConsoleChrome DevTools
For detailed debugging, Chrome DevTools' Performance panel shows you exactly what is causing slow LCP and INP. The Layout Shift regions panel helps you identify CLS issues. This is more technical but provides the most precise diagnostic data.
Web Vitals Extension
The free Web Vitals browser extension shows Core Web Vitals scores in real-time as you browse any page. It uses field data methodology, so it closely matches what Google sees. This is useful for quick checks during development.
How to Improve Largest Contentful Paint
LCP optimization focuses on making the largest visible element load as fast as possible. Here are the specific techniques that produce the biggest improvements.
Optimize Images for LCP
Images are the most common LCP element. Unoptimized hero images are the number one cause of slow LCP scores.
Use WebP format: Set explicit dimensions: Implement lazy loading correctly: Use responsive images:Improve Server Response Time
Your server needs to respond to requests quickly. A slow Time to First Byte (TTFB) directly impacts LCP because nothing starts loading until the server responds.
Use a Content Delivery Network (CDN): Enable server-level caching: Upgrade your hosting:Reduce Render-Blocking Resources
CSS and JavaScript files that block the page from rendering slow down LCP because the browser cannot paint content until it processes these resources.
Defer non-critical JavaScript: Minimize critical CSS:How to Improve Interaction to Next Paint
INP optimization is about reducing the time JavaScript takes to respond to user interactions. Here are the techniques that make the biggest difference.
Reduce JavaScript Bundle Size
Large JavaScript files take longer to parse and execute, which increases INP. Audit your JavaScript with tools like Bundlephobia or Chrome DevTools to identify heavy dependencies.
Remove unused JavaScript: Code splitting:Minimize Main Thread Blocking
Long JavaScript tasks that run on the main thread block the browser from responding to user input. The key is breaking long tasks into smaller chunks.
Use requestIdleCallback: Debounce event handlers:Evaluate Third-Party Scripts
Third-party scripts from analytics tools, chat widgets, ad networks, and social media embeds can severely impact INP. Each additional script adds to the JavaScript execution time.
Audit third-party impact: Delay non-essential scripts:How to Improve Cumulative Layout Shift
CLS optimization is about preventing unexpected visual changes during page load. The fixes are often simple but frequently overlooked.
Always Specify Image and Video Dimensions
The single most impactful CLS fix is adding width and height attributes to all images, videos, and embeds. Without explicit dimensions, the browser does not know how much space the element will occupy, so it reserves zero space. When the element loads, everything below it shifts down.
If you use WordPress, most modern themes handle this automatically. But if you are manually adding images to HTML, always include dimensions.
Reserve Space for Dynamic Content
If content loads above the viewport after the initial render, it pushes everything down. Common culprits include:
Ads: Dynamic content:Avoid Inserting Content Above Existing Content
Inserting new elements above the viewport after the page has loaded causes everything below to shift. This is one of the most common CLS causes on blogs.
If you need to show a notification banner or a cookie consent popup, position it at the bottom of the screen or overlay it without affecting the page layout.
Handle Web Fonts Properly
Web fonts can cause layout shifts when the fallback font and the loaded font have different dimensions. To prevent this, use font-display: optional or font-display: swap in your CSS. This tells the browser to use the fallback font initially and swap to the web font when it loads without causing a visible shift.
Prioritization: What to Fix First
When you have multiple Core Web Vitals issues, prioritize based on impact.
First, fix LCP. Second, fix CLS. Third, fix INP.Monitoring Core Web Vitals Over Time
Core Web Vitals are not a one-time fix. New content, plugin updates, server changes, and third-party script updates can all introduce new performance issues.
Monthly audits: Pre-deployment testing: Real user monitoring:The Connection Between Speed and Revenue
Page speed does not only affect rankings. It directly impacts revenue. Studies consistently show that each additional second of load time reduces conversion rates by 7-10%. For monetized blogs, this means slower pages earn less from both affiliate links and ad impressions.
When I improved Core Web Vitals on one of my sites, not only did rankings improve, but the ad revenue per page view increased by roughly 15%. Faster pages mean more page views per session, more ad impressions, and more affiliate link clicks.
Final Thoughts
bloggers who want to rank well on GoogleStart by measuring your current scores. Fix the highest-impact issues first. Then monitor regularly to catch regressions. Over time, consistently good Core Web Vitals become a competitive advantage that helps your content outrank technically inferior competitors.