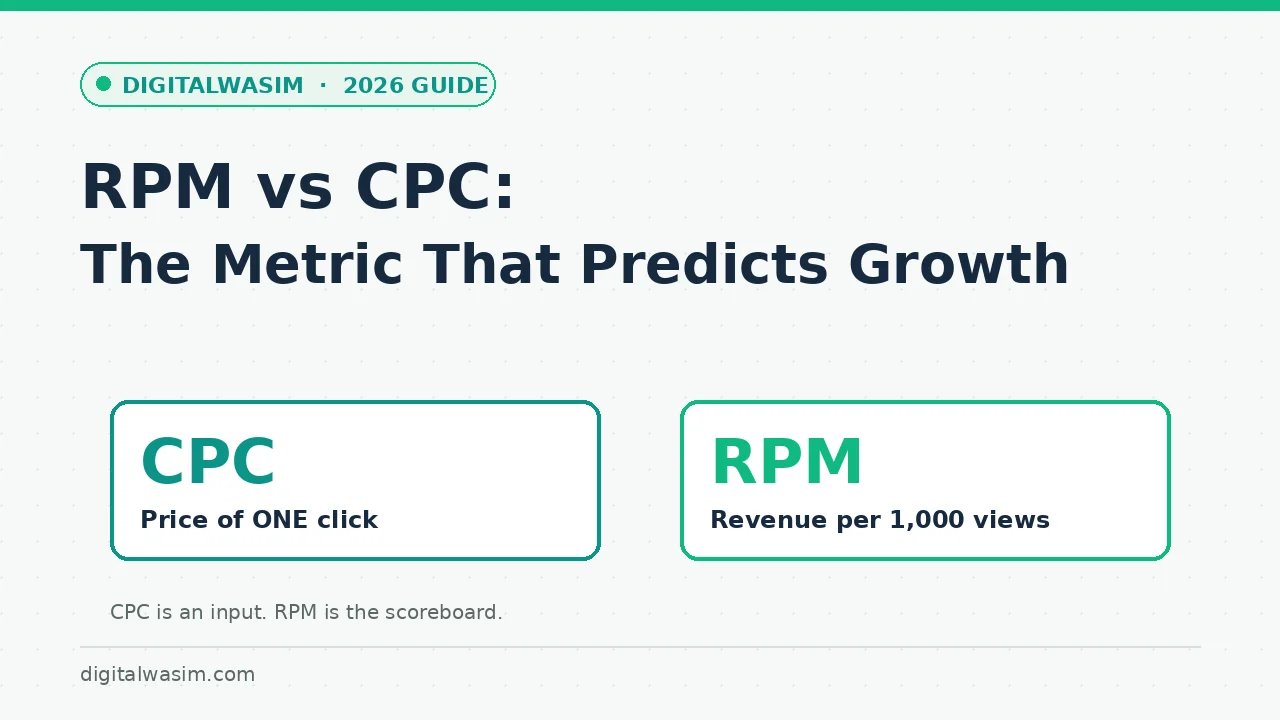
Two numbers dominate every publisher's dashboard conversation: RPM and CPC. They get quoted like rivals, celebrated in the same breath, and blamed interchangeably when revenue dips. The confusion is expensive, because the two metrics measure completely different things, respond to completely different levers, and predict completely different futures for your site. Optimizing the wrong one is how blogs spend months polishing a number that cannot grow.
This RPM vs CPC guide settles the comparison the way a CFO would: definitions from official documentation first, then how the metrics connect mathematically, then which one deserves your attention at each stage of a blog's life, and finally the diagnostic sequence for the months when the numbers move without asking permission. No jargon walls, no invented benchmarks, just the mechanics and the judgment calls around them.
Quick answer:The Two Metrics, Defined Without Jargon
CPC, cost per click, is the price an advertiser pays each time a reader clicks their ad. It is set by auction: competition for the keyword, the advertiser's bid, quality factors, and geography all push it around. For the publisher, the practical cousin is earnings per click, your share of that auction outcome, but the headline CPC number is fundamentally a market price, not something you control directly.
documentationYou will meet RPM in three costumes: impression RPM, measured per thousand ad impressions served; page RPM, measured per thousand page views; and session RPM, measured per thousand visits. Impression RPM belongs to the ads team's world, page RPM to individual page debugging, and session RPM to the business as a whole. Knowing which costume a report is wearing prevents most cross-metric arguments before they start. Keeping the three apart also keeps your experiments clean, because a placement test measured against the wrong denominator looks like a loss no matter what the reader actually did.
RPM vs CPC Side by Side
Put side by side, the two metrics stop looking like rivals and start looking like what they are: an ingredient label and a nutrition score. The table below is the comparison worth screenshotting:
| Dimension | CPC | RPM |
|---|---|---|
| Measures | Price of one click | Blended earnings per thousand units |
| Controlled by | Advertiser auction, niche, geo | Everything you do: content, layout, ads, traffic mix |
| Sensitive to | Keyword competition, season | CPC, CTR, coverage, viewability, pages per session |
| Best used for | Diagnosing why a niche pays | Judging overall revenue health and growth |
| Typical trap | Chasing expensive keywords | Comparing across sites with different audiences |
The control row is the one that matters. CPC lives in other people's auctions, RPM lives in your hands. That asymmetry is the entire strategic case for treating RPM as the primary number and CPC as context, and it holds whether your traffic is a hundred visits a day or a hundred thousand.
Why Chasing CPC Quietly Kills Revenue
Here is the trap in action, and almost every publisher falls into it once. A finance-adjacent post starts earning clicks at impressive per-click prices, so you pivot the whole content plan toward expensive keywords. Three months later revenue is flat or worse, because the expensive clicks came with brutal CTRs, thinner reader intent, and an audience that now trusts the site less. CPC went up; RPM, the actual business, went nowhere.
The reverse pattern is just as common and much happier. Sites that improve reader fit, page speed, and placement quality often see CPC barely move while RPM climbs steadily, because click-through and viewability improved underneath. That is what compounding growth looks like in ad economics: quiet input improvements stacking into a headline number that keeps rising without any single dramatic change.
Seasonality ties both metrics to the calendar. Advertiser budgets swell around retail events and shrink in early-year lulls, so CPC and RPM both wobble month to month through no fault of yours. Judge every metric against the same period last year before declaring a trend, and never restructure a working ad setup in January panic. Time-of-year noise is not a signal, and reacting to it creates real problems out of imaginary ones.
A Worked Example: Two Blogs, Two Strategies
A worked example makes the arithmetic visceral. Two hypothetical blogs, identical traffic of fifty thousand monthly views, opposite strategies. Blog A chases high-CPC finance keywords; Blog B builds for its real audience with balanced placements. The numbers below are illustrative arithmetic, not reported data, but the shape of the outcome repeats across real sites constantly:
| Metric | Blog A: CPC chase | Blog B: RPM focus |
|---|---|---|
| Average click value | High, expensive-keyword auctions | Modest, mainstream topics |
| Click-through rate | Low, commercial ads meet casual readers | Healthy, ads match reader intent |
| Viewability and speed | Heavy layouts drag viewability | Light pages, ads seen and clicked |
| Resulting RPM | Underwhelming despite fancy clicks | Steadily higher blended outcome |
The lesson hiding in the table is that click price is an input the market controls, while everything Blog B does well is input you control. That is why two blogs with identical traffic and near-identical topics can sit an order of magnitude apart in earnings, and why the gap rarely has anything to do with which blog found the expensive keywords first.
The Levers That Actually Move RPM
ad performance documentationAudience levers are the compounding ones. Geographic mix shifts what advertisers pay on average, which is why the same page earns differently across regions, and why traffic quality work is also revenue work. Returning readers develop banner tolerance but also deeper sessions, which changes which ad formats deserve inventory. None of these levers exist in the CPC column; every one of them shows up in the RPM line within a reporting cycle or two, which is exactly what makes it the metric worth managing.
The Diagnostic Sequence for Slow Months
When revenue moves and you need to know why, diagnose in this order. Each step isolates one input, which is the only way to find the real cause instead of the loudest coincidence. This sequence has saved publishers from more bad redesigns than any other checklist I know:
- Confirm the denominator first: did traffic, pageviews, or sessions change, because volume shifts fake metric changes.
- Check click-through rate by page type: falling CTR usually points to layout, placement, or audience-intent drift.
- Check coverage and viewability: ads that stopped serving or fell below the fold cut RPM with CPC untouched.
- Segment by geography and device: a traffic mix shift toward lower-paying regions moves RPM within days.
- Compare against the same month last year before treating anything as a trend.
- Only then look at CPC by topic: expensive clicks on pages nobody clicks are vanity, not growth.
Notice that CPC sits last, not first. By the time you reach it, you already know whether the click price is the story or just the most dramatic-looking number in the report. Diagnosis by sequence beats diagnosis by vibes every single time, and it takes about twenty minutes in a normal dashboard. Write the findings down either way, because three months of dated notes turn every future dip from a mystery into a lookup, and that notebook becomes the most underrated revenue tool on your desk.
The Metric That Predicts Growth (and How to Instrument It)
So which metric predicts growth? Revenue that compounds comes from RPM, because RPM is where your controllable work accumulates: better-fitting content attracts commercial intent, faster pages keep viewability high, smarter placements lift CTR without poisoning the reading experience, and returning readers deepen the session depth that session RPM rewards. None of those levers exist in the CPC column.
AdSense approval guide Google Analytics guide monetization guide bounce rate guide